

Performance often gets too little attention during development. In an earlier blog post, developer Steve Lievens explained why database performance is crucial from day one. This follow-up dives into practice: how do you concretely incorporate performance into your code?
Most software projects have tight deadlines and limited budgets. As a result, unit, integration, and load tests, as well as performance, are often sacrificed for a quicker delivery time.
Initially, everything often seems fine. The application runs smoothly on the developer's machine because their local database contains hardly any data. In the test environment, it performs well because there are only a few users testing simultaneously.
But with insufficient attention to performance, you run the risk of an app slowing down in production, resulting in dissatisfied users and a disappointed client. Therefore, ensure optimal execution of the queries on the database during development.
After writing a query in an ORM (Object-Relational Mapper), we examine how that query translates to SQL (Structured Query Language) and how the database executes it.
Until recently, SQL Server Profiler was the ideal tool. You start Profiler from SQL Server Management Studio (SSMS) or from Azure Data Studio with the SQL Server Profiler extension. But at the beginning of 2025, Microsoft announced that SQL Server Profiler would be replaced by Extended Events. The Profiler extension already works with the new Extended Events.
Though SQL Server Profiler is an older tool that may be familiar to many users, Extended Events is a modern alternative that offers better performance, more detailed event information, and capabilities for troubleshooting and monitoring SQL Server instances not available elsewhere. Due to its advantages over Profiler, Extended Events is recommended for new tracing and monitoring work.
The same applies to Azure Data Studio, which will no longer be supported starting next year. As stated on the website:
We’re announcing the retirement of Azure Data Studio (ADS) on February 6, 2025, as we focus on delivering a modern, streamlined SQL development experience. ADS will remain supported until February 28, 2026, giving developers ample time to transition.
In the world of software, change is the only constant: RIP SQL Server Profiler, RIP Azure Data Studio.
After we connect to our SQL Server instance, we navigate to Management Extended Events Sessions. We right-click on it and then choose New Session Wizard. We give our session a name and select an event session template.
We select templates from these, including several Profiler Equivalents, clearly intended to replace Profiler. Let's start with Standard.
We retain the suggested events, but in global fields we select database_name and username. In the next screen, we can set filters, but this can also be done after the session has started – we leave it empty for now.
Next, we select Work with only the most recent data, because in this case, we are not looking for queries from the past. We want to investigate the current situation.
In the final step, we choose to start the session and display live data on the screen (you can also log to files or another database).
Subsequently, the executed queries appear on the screen. By default, you only see the name and timestamp of the event. We add the columns database_name, username, client_app_name, and batch_text to this.
Since a lot of queries can come through now, we set up filters. You can filter by database_name and (event)name, for example, rpc_completed. This makes it easier to find the right query.
A tip? Use Application Name in the application's ConnectionString. Then you can filter on that and only get the queries from your application or API.
"ConnectionString": "Server=tcp:...,1439;Database=...;User Id=...;Password=...;Application Name=Base Admin API"
Now that we see our queries coming through, we can study them further.
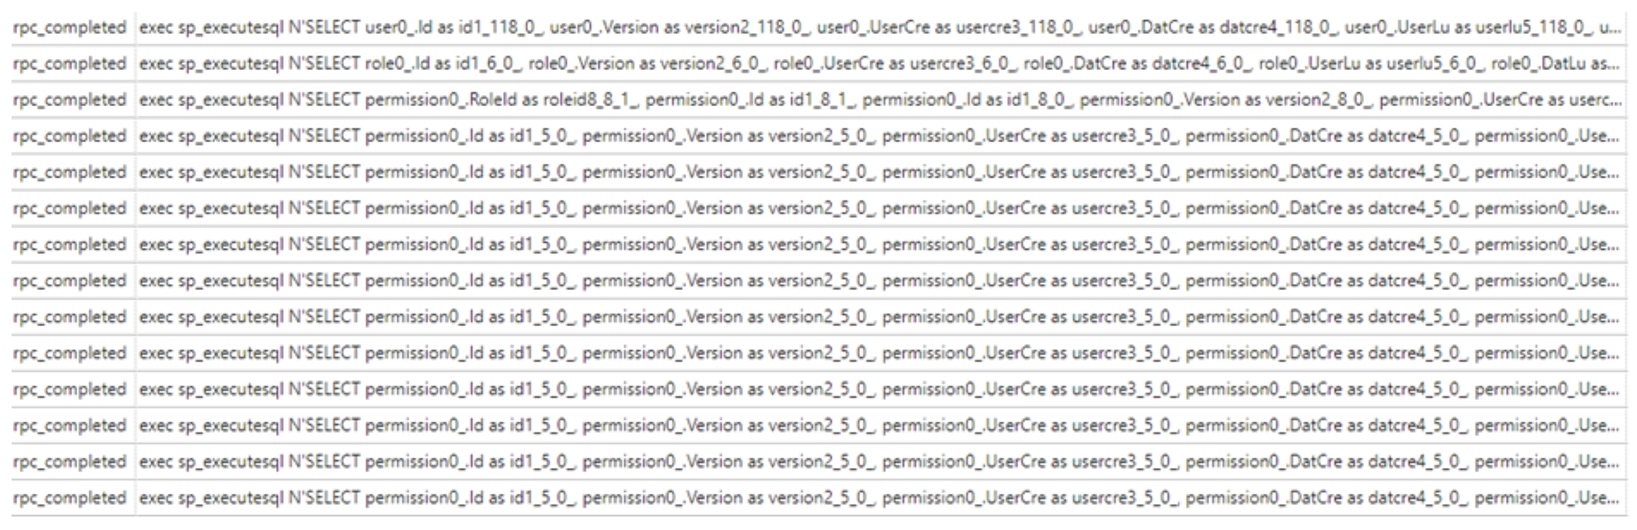
You might expect that many small queries are faster than one large, complex query. That is not the case.
Each query is sent to the database, parsed, analyzed, and executed, after which the results return to the application. The more queries, the more time it takes to get the results back. A single query, even if complex, can often be optimized by the database server. Since only one trip to the database is needed, this is faster.
There are two possible solutions to the problem of many separate queries: eager or selective loading.
NHibernatevar user = _session.Query().Fetch(u => u.Role.Permissions).ToList();
Entity Frameworkvar user = context.Users.Include(u => u.Role.Permissions).ToList();
var userDetails = context.Users.Select(u => new
{
u.Id, u.FirstName, u.LastName, Permissions = u.Role.Permissions.Select(p => new { p.Code, p.AccessRight })
}).ToList();
In both cases, the ORM will add a join clause to our query to fetch all the data at once. Projection is generally a good idea, not just to solve N+1 queries.
Suppose you have a table with 40 columns and you only want to retrieve the columns Id, FirstName, and LastName. An ORM typically retrieves the entire entity, which is a huge waste. With eager loading, we must be careful not to fetch too much data, as this can have equally negative consequences as N+1 queries. Therefore, it is important to profile and monitor our queries.
When we enable the Include Actual Execution Plan option in SSMS, we can view the query plan of our query.
This execution plan is displayed using graphical icons connected by arrows. Each icon represents a step in the query processing, such as scans, searches, joins, or sorts.
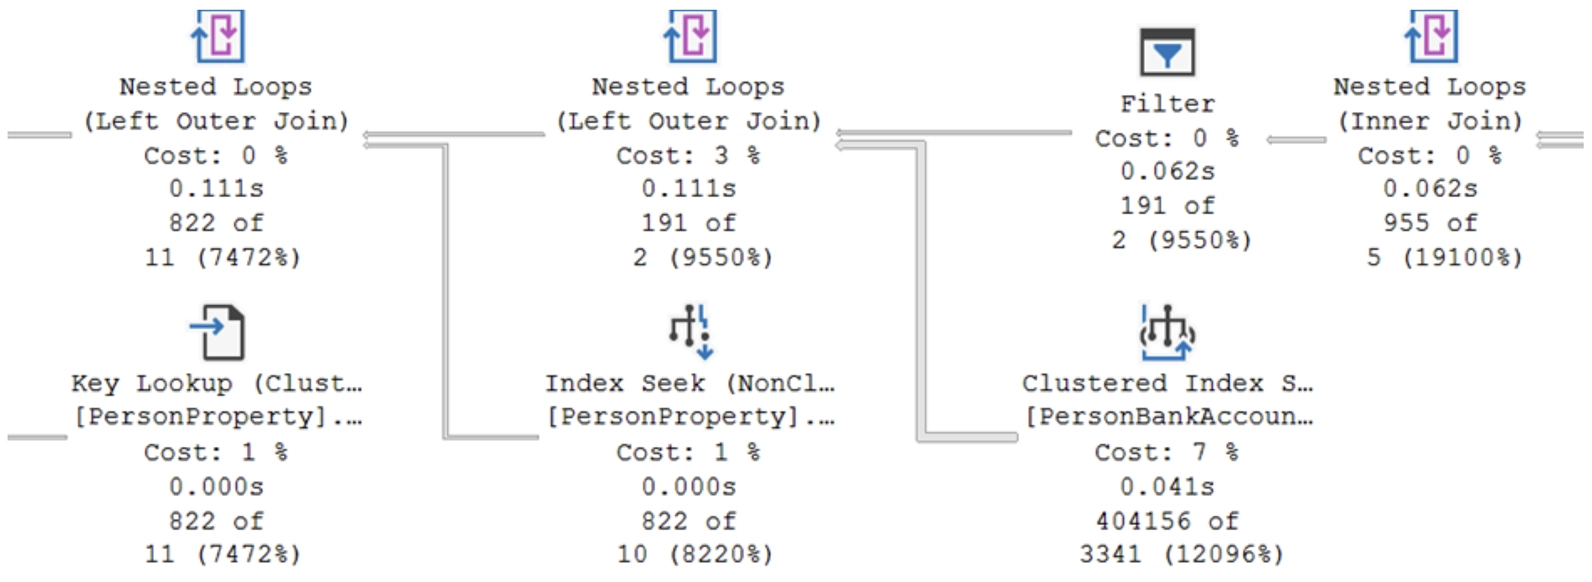
Key Components of a Query Plan
Scan or Seek
Avoid table scans at all costs: this often means there is no index on the table.
Missing Index Suggestions
In some cases, SSMS suggests creating indexes to improve performance. These suggestions appear as green text under the execution plan.
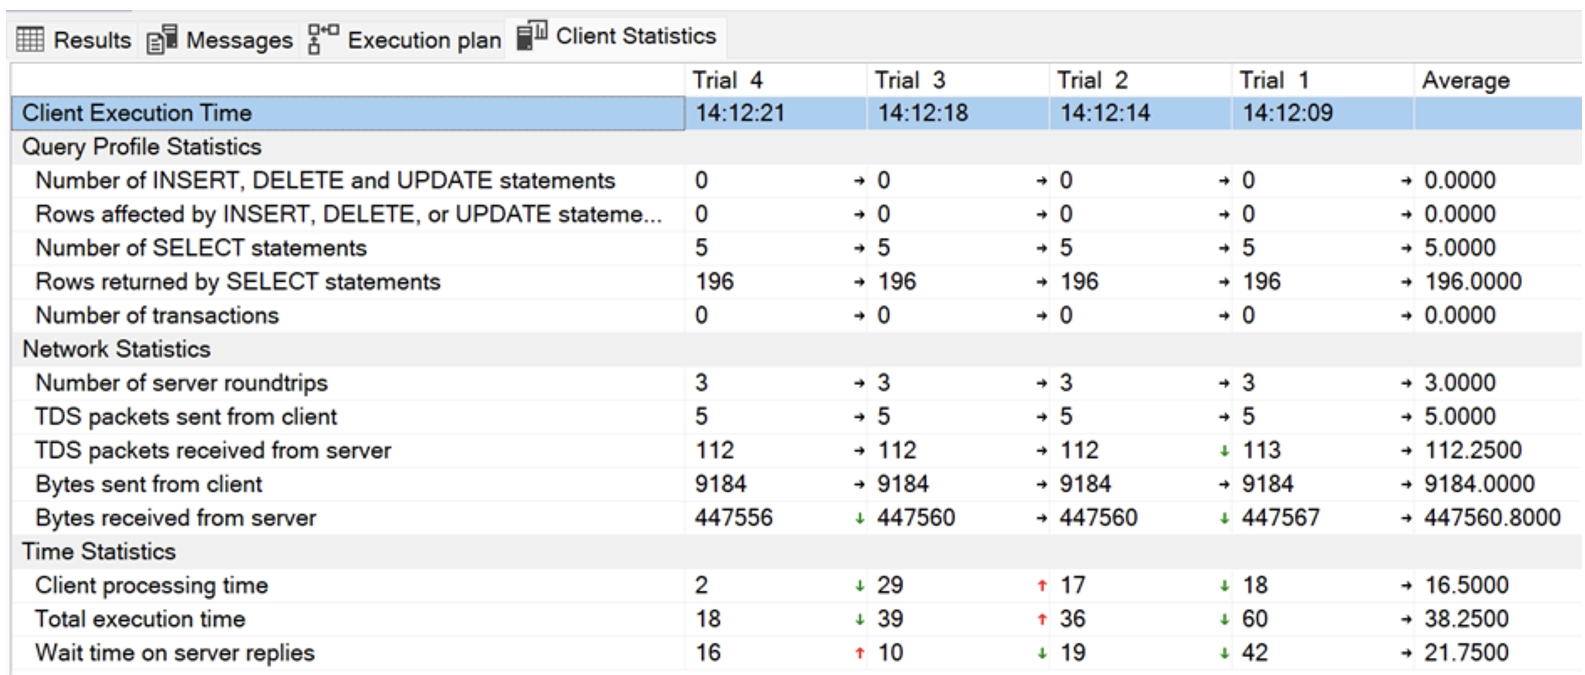
By right-clicking on the notification and selecting Missing Index Details, we immediately receive a script to add the index. Here, we see that the Query Processor estimates that adding this index will make the query 15% less burdensome.
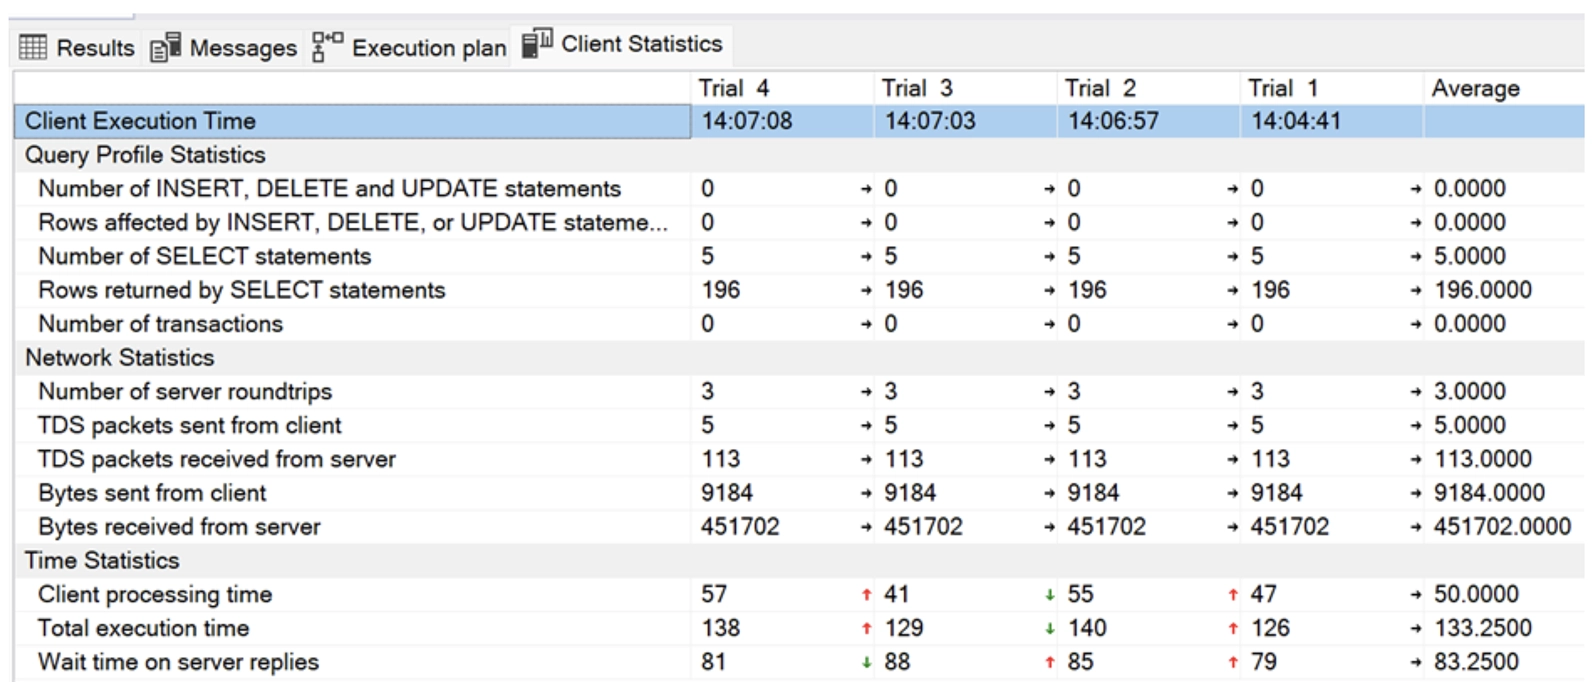
If we enable Include Client Statistics in addition to Include Actual Execution Plan, we get detailed figures about the consumption, network, and timing of our query. This is how the statistics look before the index is created.
Indexes
There are two types of indexes: clustered and non-clustered.
A clustered index is always faster because the non-clustered index points to the clustered index, thus requiring an extra step.
When our code is running in production, it's important to continue monitoring whether our queries are performing well. As the amount of data increases, the behavior of indexes can change, and even the query plan can be altered.
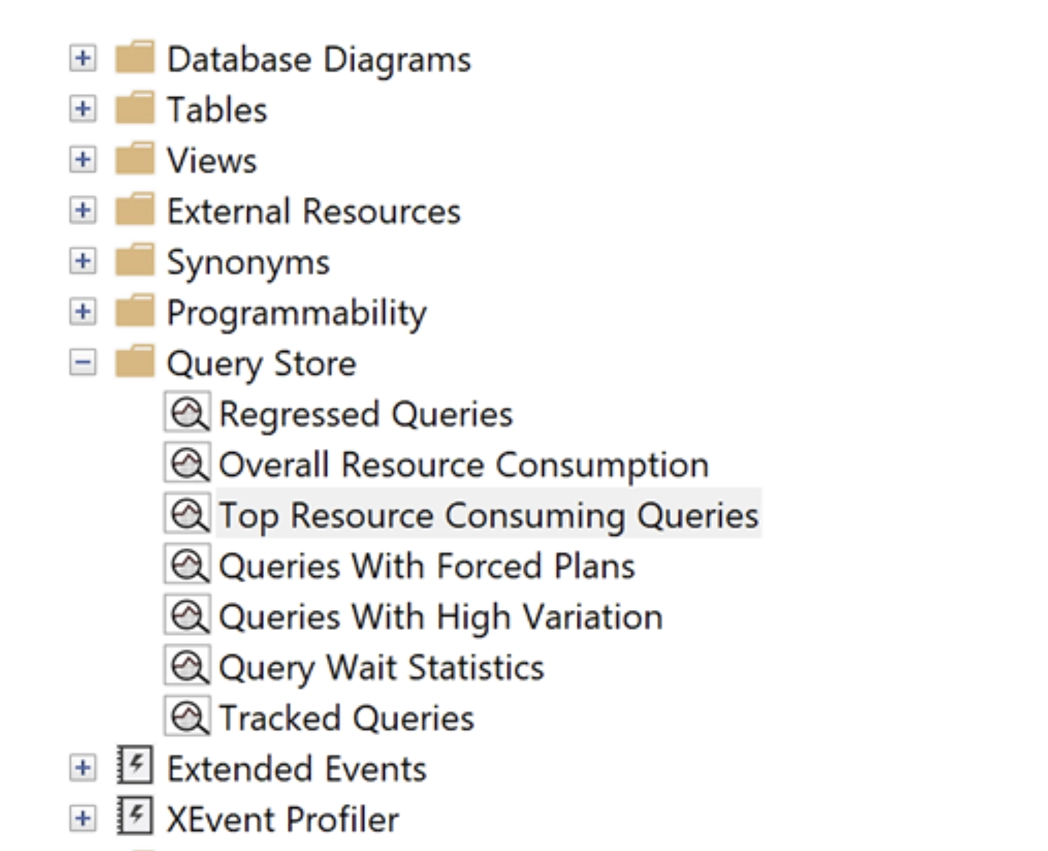
SQL Server already provides several statistics that are definitely worth checking out.
Additionally, at Teal Partners, we also use SolarWinds and the free First Responder Toolkit (sp_Blitz) by Brent Ozar to detect and investigate issues.

